Introduction
I have thought of building this series in long time ago, to make some advanced series of article for you to learning what is beyond. And because you’re reading this series, I am expecting that you’re likely familiar with the basics of statistics. You’re now ready to take it to the edge. That next level involves using what you know, picking up a few more tools and techniques at the intermediate level, and finally putting it all to use to help you answer more realistic questions by using real data.
statisticaly speaking, you should be ready to enter the world of the data analysis. This world’s an exciting one, with many options to explore and many tools available. But, as you may have guessed, you have to navigate this world very carefully, choosing the right methods for each situation and watch out some circumstances.
In this series (and be sure it is long one indeed 🤯), you can see that I’m including the underlying theories and ideas behind the methods and I am sure that by doing this it will help you make good decisions — and not just get into the point-and-click mode that today’s software packages offer.
In this part of the series (actually the next one too 😅), you review the terms involved in statistics as they related to data analysis at the intermediate level. You get a glimpse of the impact that your results can have by seeing what these analysis techniques can do. You also gain insight into some of the common misuses of data analysis and their effects.
Now, let’s get started 😋😋😋.
What You Need to Know Before Getting In
Many people don’t realize that statistical softwares or packages and even programming languages can’t tell you when to use and not to use a certain statistical technique. And that’s on you to determine that technique. As a result, people think they’re doing their analyses correctly, but they can end up making all kinds of mistakes. Statistical software packages are centered on mathematical formulas, and mathematical formulas aren’t smart enough to know how you’re applying them or to warn you when you’re doing something wrong (we will figure some sort of things together).
In this article from the series, I give some examples of some of the major situations where just data analyses can go wrong and why it’s important to know what’s happening behind the scenes from a statistical standpoint before you start crunching numbers.
Nothing (even a straight line) lasts forever
After you get a statistical equation (model in our case), that tries to explain or predict some random phenomena, you need to specify for what values the equation applies and for what values the equation doesn’t apply. Equations don’t know when they work and when they don’t (it’s just explaining something). This idea is the same for applying the results of any data analysis that you do.
Let’s suppose that a random statistics student called Joe, studying the affect of study time on exam score, which is a great study indeed.
Based on his experience, and that of a few friends, Joe comes up with the equation y = 10x + 30, where y represents the test score you get if you study a certain number of hours (x).
This equation is Joe’s model for predicting exam score using study time. > Notice that this model is the equation of a straight line with a y-intercept of 30 and a slope of 10.
So Joe predicts, using this model (equation above), that if you don’t study at all (hours will be 0), you’ll get a 30 on the exam (plugging x = 0 into the equation and solving for y; this point represents the y-intercept of the line). And he predicts, using this model, that if you study for five hours, you’ll get an exam score of y = 10 * 5 + 30 = 80. So, the point (5, 80) is also on this line.
I’m sure you would agree that because x is the amount of study time measured by hours, that x can never be a number less than zero.
If you plug a negative number in for x, say x = –10, you get y = 10 * –10 + 30 = –70, which makes no sense.
> The worst possible score, according to Joe’s model, is 30, which occurs when x equals 0.
And, you can’t study a negative number of hours, so a negative number for x
itself isn’t even possible.
On the other side of the coin, x probably isn’t a number in the two-digit range
(10 or more). Why is this? Let’s say that someone did study ten hours (x = 10) for this exam. Plugging in the Joe’s equation, you get y = 10 * 10 + 30, which makes y =
130.
Remember, y is the predicted exam score. Because most exams are out of 100 possible points, a score of 130 isn’t possible (which is 100 max).
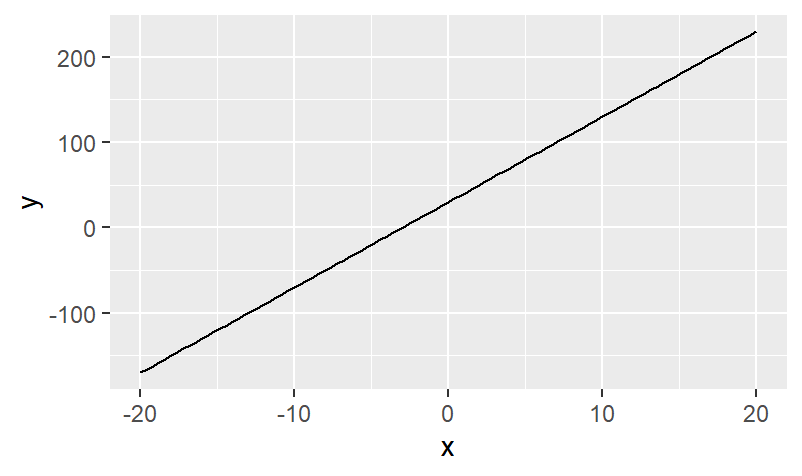
We get that, there are limits on the values of
xthat make sense in this equation. However, the equation itself,y = 10x + 30, doesn’t know that, and if you graph this line, it’ll go on forever in both the positive and negative directions (see Figure 1-1).
Data snooping isn’t cool
Statisticians have come up with a saying that you may have heard of:
Figures don’t lie. Liars figure.
Make sure that you find out about all the analyses that were performed on a data set, not just the ones reported as being statistically significant.
Suppose that Joe tries to apply his simple model to predict exam scores for his whole class, based on their reported amounts of study time, and he finds out that his results are the same for all.
He figures out that he needs more information, so he tries to uncover what other factors help determine exam score on a statistics test besides study time.
Joe measures everything from soup to nuts. His set of possible variables such as:
- study time.
- GPA.
- previous experience in statistics.
- math grades in high school
- attitudes toward statistics.
- whether you listen to classical music while studying
- shoe size.
- whether you chew gum during the exam.
- and even what your favorite color is.
For good measure, he includes 11 other variables, for a total of 20 possible factors that he thinks may relate to exam score.
Joe starts out by looking for relationships between each of these variables and exam score, so he does 20 correlations.
Correlation is a measure of the linear relationship between two variables. We will make a full article on it.
He finds out that four variables have a statistically significant relationship with exam score.
if you didn’t get it, that’s means the results are supposed to be correct with a 95% — but only if he collected the data properly and did the analysis correctly. And we will make a full article on this concept too.
The variables that Joe found to be related to exam score were the following:
- study time.
- math grades in high school.
- GPA.
- and whether the person chews gum during the exam.
It turns out that his new model fits pretty well.
will discuss the how to make a model and get it’s result in a full article.
Joe now thinks he’s scored a home run and has answered that all-elusive question: How can I do better on my statistics test?
By looking at all possible correlations between his 20 variables and exam score, Joe is actually doing 20 separate statistical analyses. Under typical conditions (Which will be discussed later), each statistical analysis has a 5% chance of being wrong just by chance
Just for your info: this value of 5 percent is called the significance level of the test.
Because 5% of 20 analyses is equal to one, you can expect that when you do 20 statistical analyses, one of them will give the wrong result, just by chance, over the long term.
I bet you can guess which one of Joe’s correlations likely came out wrong in this case. Of course, study time has nothing to do with exam score, and gum-chewing is the answer to all of our problems, right?
If that were the case, all statisticians would be out of business and working for chewing-gum companies instead. 😂😂😂😂
What Joe is doing is called data snooping in the data-analysis business. Joe looks around until he finds something, and then he believes the result. This strategy is dangerous, but one that’s done all too often in the real world. One of the reasons data snooping is running rampant today is because everyone and his brother is out there collecting data and analyzing it — and everyone wants to find something.
They’re using statistical software that allows them to just point and click to do as many analyses as they want, without any warning about what statisticians call the overall error rate 😫 (that is, the probability of making an error due to chance during any step of the entire analysis, not just the probability of making an error due to chance on any single analysis).
No (data) fishing allowed
Redoing analyses in different ways to try to get the results you want is called data fishing in the statistics business, and folks consider it to be a major no-no 😕😕 (however, people unfortunately do it all too often in the name of research).
Let’s stop here, and continue the science in the next article.
What Now 🤔
This part of the series is ends here, but the series continues. Stay tuned for the next part, if not uploaded yet 😅. And if you have any feedback, you can send me on email or twitter.
See You Soon, Hisham.